


I have sat in planning meetings that ran like this. Finance opens with the number the business has to hit: grow revenue fifteen per cent. Four slides later, the second instruction lands. Take five per cent out of every cost line, flat, across the board. No guidance on which parts of the plan matter more than others.
Marketing then spends three weeks rebuilding last year’s plan to fit a number it had no hand in setting.
The Budget Gets Set Before the Strategy argued why that order is wrong. Here are the seven steps I use instead, and a worksheet to run them on.
1. Split the revenue target by source of growth
“Grow revenue by fifteen per cent” tells you the size of the gap. It does not tell you what has to happen for the business to close it. Splitting the target means writing down which parts of the business produce those fifteen points, and how many points each one produces.
There are a limited number of places growth comes from. Work through the list:
more customers in markets you already sell to
existing customers buying more, buying more often, or buying a second product
a price rise or a shift in product mix
a new product
a new segment or a new geography
fewer customers lost
Get the split from finance first. The annual plan or the board pack usually carries revenue by product, by region, by segment, and by new versus existing customer. That is most of the work already done. Where it does not exist, build a draft yourself from last year’s actuals plus the growth assumptions each business owner is carrying. Then send that draft to your finance business partner and the sales leader and ask them to mark it up, rather than asking them to produce one from scratch.
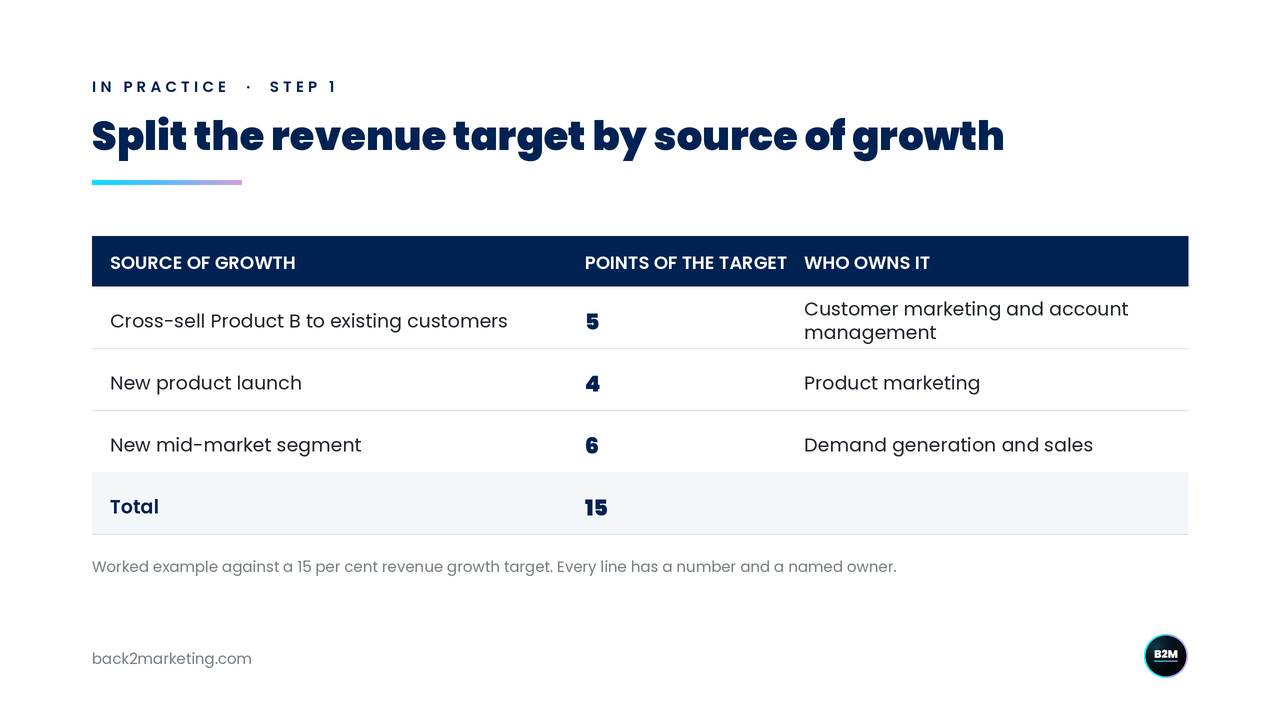
Then test it. The points add to fifteen. Every line has a named owner. Every line is plausible against what that part of the business delivered last year. If cross-sell grew two points last year and the plan needs five, someone has to say what changes to make up the difference.
The marketing requirement for each source of growth is different. Six points from a segment the company does not sell to today needs awareness, credibility and demand creation from a standing start, and that is expensive. Five points of cross-sell to customers who already buy needs customer marketing and sales enablement, which costs far less. A single blended target gives you no way to tell those apart, and an even five per cent cut treats them as if they were the same.
Ask finance for the revenue plan split by product, segment and new versus existing customer. That document is where the marketing budget starts.
2. For each source of growth, name what is blocking it
For each source of growth, write what has to become true among customers. Six points from mid-market means buyers in that segment have to know the company exists, believe it serves businesses their size, and have a reason to put it on a shortlist.
Then name the single biggest obstacle standing in the way: awareness, consideration, the proposition, price, the route to market, sales capacity, or product fit.
This is what decides where the money goes. If mid-market buyers already know the company but do not believe it serves businesses their size, more media buys more of the wrong impression. The work is proposition and proof: segment-specific messaging, customer evidence, pricing and packaging. If they have never heard of the company at all, reach is the job and media is the answer.
Write the obstacle next to each source of growth and keep it there. When someone proposes a new campaign or channel in March, you have a written test for it: which of these obstacles does it remove, and for which source of growth?
Fund the thing blocking growth, not the activities that ran last year.
3. Convert marketing’s contribution into outcomes with owners
Write what marketing will deliver as measurable outcomes rather than as a list of campaigns.
Not six campaigns, three events and a content programme. Instead: unaided awareness in the mid-market segment from 8 to 20 per cent by the end of Q3. Consideration from 12 to 20 per cent. Four hundred qualified opportunities into the mid-market sales team at an average deal size of $40,000.
Each outcome needs a measure, a baseline, a target, a date and a named owner. Written that way they can be tracked through the year, defended in a review, and renegotiated when the budget moves.
Write the dependencies on other teams in the same place. If four hundred opportunities only produce the revenue when sales converts at 22 per cent, and sales has converted at 15 per cent for two years, put both numbers in the plan and name who owns closing that gap. Without it, marketing carries the revenue number while another team controls half of what produces it.
An outcome with a baseline, a target, a date and an owner survives a budget negotiation. An activity list does not.
4. Cost what the strategy requires, then take it to finance
Now build the cost, starting from the work each outcome needs: research, brand development, creative, content, media, events, partner programmes, product marketing, customer marketing, technology, agency support, headcount.
Mark Ritson made this argument for zero-based budgeting in 2016: the team researches, builds the plan and finishes with a request and a promised return, rather than inheriting a percentage of projected sales.
Cost the full period the outcomes need. Awareness built in Q3 does not convert in Q3. If the plan needs twelve months of sustained investment and the budget funds three, the plan will not deliver what it says it will.
Put the full cost in front of finance before you take anything out of it. A number you have already trimmed to what you think will get approved leaves the business with no view of what the growth target actually costs.
Present the full cost of the plan. Let the business decide what to remove, with the consequence written next to it.
5. Separate committed, core and strategic money
Three categories, each with a dollar figure against it.
Committed: contracts, technology platforms, sponsorships and agency retainers already signed
Core: salaries, tools and infrastructure that run the function
Strategic: media, research, creative development, new market activity, testing
Take a $10 million budget with $6 million in committed and core costs. Four million funds growth. A ten per cent cut to the total is $1 million, and because the committed costs are contracted, it comes out of the strategic line. That is a 25 per cent cut to the growth money.
Show all three figures every time the total is discussed, so the conversation about a cut happens against the $4 million rather than the $10 million.
Show the total, the committed and core costs, and the money actually available to fund growth.
6. Cost three scenarios and state what each one delivers
Minimum viable: the lowest investment that still delivers at least one source of growth in full. Do fewer things properly rather than fund all three sources at a level too low to work anywhere.
Recommended: the investment that funds every outcome in step 3, with the evidence and assumptions attached.
Accelerated: what more money buys, and how much more it costs.
Against each scenario, write out what the business gets and what it gives up:
which sources of growth are funded, part funded or dropped
reach and frequency in each target segment
which geographies are included
what happens to the launch date
what happens to brand investment against lead generation
Then put the revenue consequence next to each one, in the same units finance used. If the minimum viable scenario drops the mid-market segment, the plan delivers nine points of growth rather than fifteen. Write that on the slide.
If the plan goes to the board, present the marketing strategy to the board in the same terms: the growth each scenario delivers and what it costs.
Every scenario carries the growth it delivers. A cheaper budget with the same revenue target is not a scenario.
7. Check the recommendation against both benchmarks, last
Two checks, answering two different questions.
Spend as a percentage of revenue. Gartner’s 2026 CMO Spend Survey of 401 marketing leaders puts marketing budgets at 7.8 per cent of company revenue. The CMO Survey, covering 308 US marketing leaders, puts it at 9.0 per cent. Grace Kite’s analysis of three datasets, reported by Mark Ritson, supports 5 to 10 per cent of turnover on advertising, with 10 per cent as a practical starting point. Those three broadly agree, so treat 5 to 10 per cent as what a typical established business spends to hold its position.
Share of voice against share of market. This is the more useful test, because it measures you against your competitors rather than against an average of everyone. Binet and Field’s analysis of the IPA Effectiveness Databank found that brands spending a larger share of category advertising than their share of market tend to gain share, at roughly half a point of market share for every ten points of that excess. It varies by category, brand size, channel and pricing power, so use it as a direction rather than a formula.
Run both, then explain where you sit.
Above 10 per cent of revenue. This is what buying share looks like. Taking share from a competitor means outspending your current share of market, and that shows up as a higher percentage of revenue. Entering a new market, launching a product, and recovering from several years of underinvestment all do the same thing. Say which one applies and for how long.
Inside the range, but losing share. The total looks normal while competitors outspend you in the places that matter. Check share of voice inside the segments from step 1 rather than across the whole category.
Below 5 per cent of revenue. Check whether the plan was costed for the growth it promises, or whether outcomes were dropped to make the number fit.
Use the benchmarks to test the number you built. Do not use them to produce it.
Next steps
Get the revenue plan from finance, split by product, segment and new versus existing customer
Write the growth split: source, points of the target, owner. Check the points add up and each line is plausible against last year’s performance
Name the biggest obstacle blocking each source of growth
Convert marketing’s contribution into outcomes with a baseline, target, date and owner, and write down the dependencies on sales and product
Split the current budget into committed, core and strategic, and find out how much is actually available
Cost the recommended scenario in full, then build the minimum viable and accelerated versions with the growth each one delivers
Check the recommendation against both benchmarks, spend as a percentage of revenue and share of voice against share of market, and write down why you sit where you sit
Build the number from the growth plan, then defend it.
Evidence informs. Judgement decides.
The Budget Build
A one page worksheet for all seven steps: the growth split table, the constraint test, the outcomes table, the committed, core and strategic breakdown, and the three scenario grid. The three published benchmarks are printed on it, so the pressure test happens on the page instead of sending you looking for numbers. Fill it in and the whole budget conversation sits on one sheet.
If you want the planning sequence behind this, from diagnosis through segmentation, targeting, positioning and objectives, the B2B Marketing Fundamentals course covers it end to end and finishes with your own One-Page Growth Strategy.
Sources
Gartner, 2026 CMO Spend Survey, published May 2026. 401 CMOs and marketing leaders in North America, the UK and Europe, surveyed January to March 2026. Marketing budgets average 7.8 per cent of company revenue, around 18 per cent below the mean four years earlier. Primary source
The CMO Survey, 35th edition, 2026. 308 US marketing leaders, 97 per cent VP or above. Marketing budgets at 9.0 per cent of company revenue. Primary source
Mark Ritson, Why Unilever is right to adopt zero-based budgeting, Marketing Week, January 2016. The team researches, builds the plan and ends with a budget request and a promised return, rather than accepting an arbitrary percentage of projected sales. Primary source
Les Binet and Peter Field, The Long and the Short of It: Balancing Short and Long-Term Marketing Strategies, IPA, 2013. Analysis of the IPA Effectiveness Databank. Brands whose share of category advertising exceeds their share of market tend to gain share, at roughly half a point of market share for every ten points of excess share of voice; the relationship varies by category, brand size, channel and pricing power. Primary source
Mark Ritson, ‘Triple-Cooked Marketing Budgets’: The full recipe, Marketing Week, October 2022. Grace Kite’s analysis of three datasets supports 5 to 10 per cent of turnover on advertising as a rule of thumb; Ritson proposes 10 per cent as a practical starting point. Primary source